
Each year, the ATTA produces the Adventure Travel Trends Snapshot report, a compilation of data resulting from a survey of adventure travel industry operators on topics such as destinations, activities, and industry business practices. The 2020 report, with data from 2019, is now available for download. Unlike previous years, the ATTA is offering this report at no cost, as a way to continue to support the adventure travel industry in this challenging time.
The 2020 report reveals industry insights such as top-of-mind adventure destinations, average trip length, common operational practices, financial data and more. The data presented in this report was collected in January and February 2020 prior to global awareness of COVID-19 and shares adventure industry results from 2019.
A few key findings in this year's report include:
- 74% of trip costs are spent with local suppliers and each guest spends an average of $206 on local handicrafts/souvenirs
- Top adventure activities are hiking; culinary, cultural, and wellness-focused activities; and electronic bike cycling
- Custom itineraries and greener/sustainable/low impact itineraries remain in high consumer demand
- Outbound adventure tour operators report the following regions experienced significantly increased client interest in 2019: South America, the Antarctic, Western Europe, Central Asia, and the Mediterranean
- 80% of adventure travel tour operator clients are between the ages of 45-64
- The average cost per day of a trip in North America in 2019 was $447
Helping the Industry Rebuild
Although last year's financial forecasts were made obsolete by the COVID-19 pandemic, many of the findings in this report may be helpful for adventure travel businesses while planning their next steps. For example, word of mouth, email marketing, and tour operator partnerships were reported as the most helpful marketing and sales tactics:
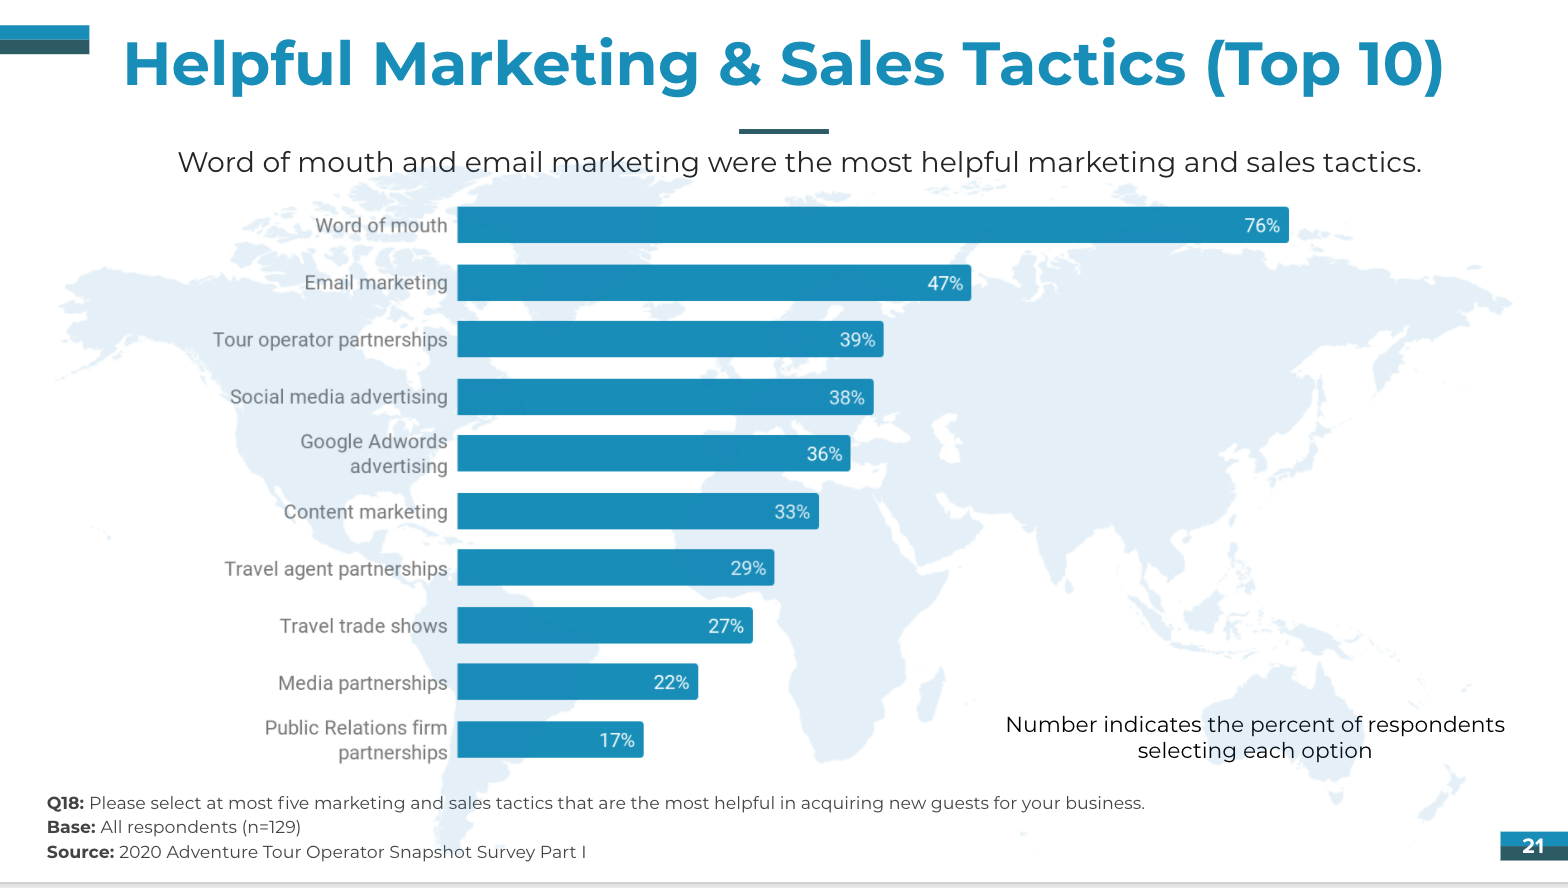
However, on average, respondents had 55% more social media followers (40,545) than email subscribers (26,104), making a diverse marketing communications approach essential.
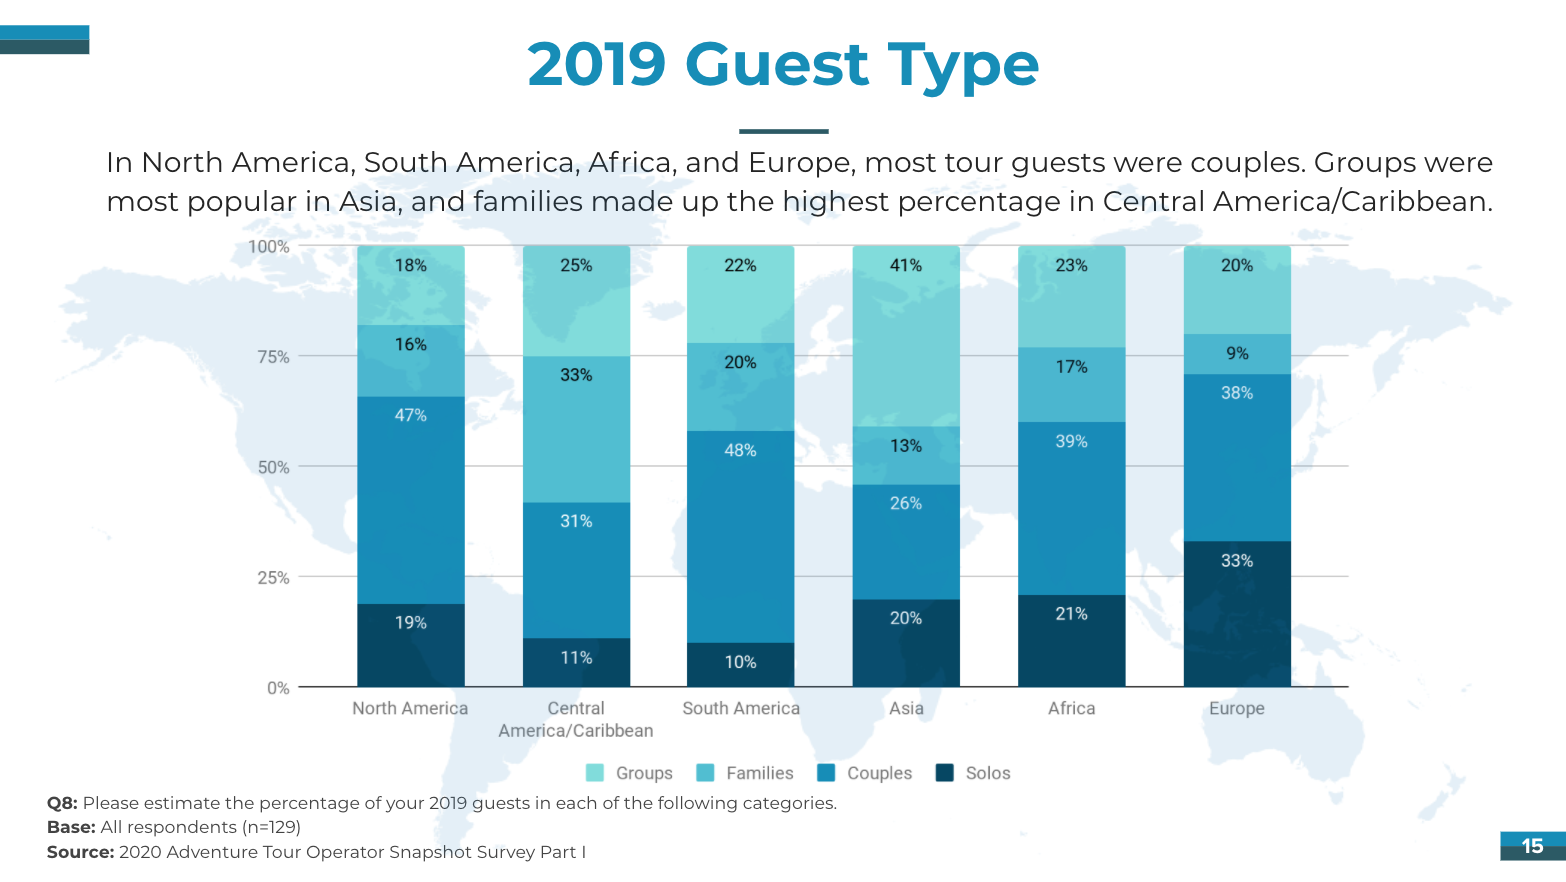
Most adventure travelers are females and are between the ages of 29-60. When it comes to the composition of tour groups, in North America, South America, Africa, and Europe, most guests were couples. Groups were most popular in Asia, and families made up the highest percentage in Central America/Caribbean:
Regarding traveler behavior, custom itineraries and greener/sustainable/low impact itineraries remain in high consumer demand. Top adventure activities reported are hiking; culinary, cultural, and wellness-focused activities; and electronic bike cycling. The average overall trip length was 8.8 days, at a total spend of $3,000 USD ($341 per day).
In 2018, 50% of respondents reported having an online reservation system taking credit cards; in 2019 this number increased to 60%. Anecdotally, the ATTA has heard that a lot of tour operators are taking this time to reorganize their business and assess their tools and procedures, and statistics like these are ones to watch in the coming years.
The 2020 Adventure Travel Trends Snapshot Report offers those working in adventure travel with critical industry benchmarks, and those outside the industry with a perspective on the health, outlook, and characteristics of this dynamic environment. While 2020 and 2021 data will look very different, this 2019 data can prove useful for organizations that are (re)building, restructuring or planning for when travelers return post-COVID.