
As part of our 2016 Industry Snapshot we identified key takeaways from the adventure travel tour operator industry. Wondering where your tour operation fits in the mix? Doing business with an operator and looking to understand the mindset driving them? Take a look at the below and consider some of the latest trends from the news: Women only tours. Cuba. Macedonia. Colombia. Biking - road, mountain, fat tire. (Yoga on a bike? Not yet.) Content and more content. New products and new destinations. Now let’s get ready for 2017; it is just around the corner.
Financial
1) A majority of adventure tour operators are bullish about revenue and profit prospects for 2016, compared to 2015, with 70% expecting their revenue to go up, and 65% thinking their profits will increase. Firms in North America and South America are particularly upbeat. However, tour operators in Europe saw the greatest increase in revenue in 2015, compared to the previous year.
2) Most commonly, new customers (or the lack of them) are the reason for a firm having a positive or negative outlook for 2016. Beyond this, the launch of new products and access to new markets are key reasons for firms to believe profits will increase, while regional crises or increased overheads are major reasons for thinking that profits will decline.
3) By some distance, North American firms report the highest per-day trip price - at $448, this is approaching twice that of the next highest region (the Middle East, at $288). However, firms headquartered in Central America/Caribbean have seen the highest increase in trip price since 2014, of 65%.
Adventure Travelers
1) Customer demographics skew slightly female (53% to 47%), particularly in Africa, where 57% of customers are female. Nearly half (45%) of customers are over 50.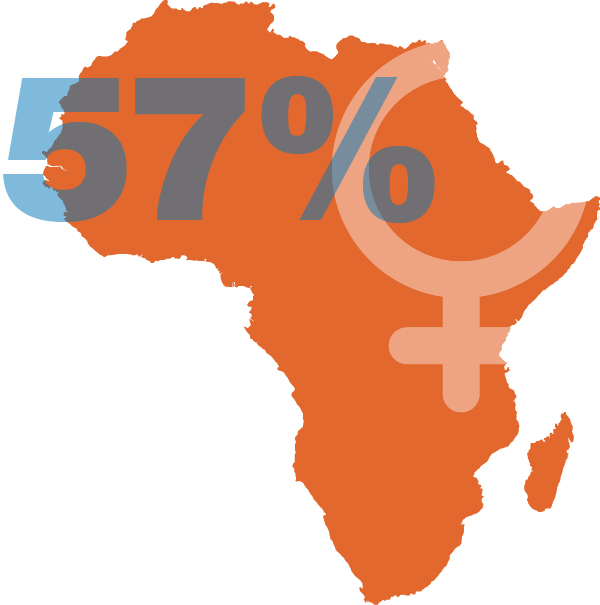
2) In tour operators’ judgment, the host region sees significant economic benefits from adventure tourism. They estimate that, on average, nearly two-thirds (65%) of the money guests spend on their trip stays in the local region, and that guests spend an average of $145 on local handicrafts or souvenir while on their trip.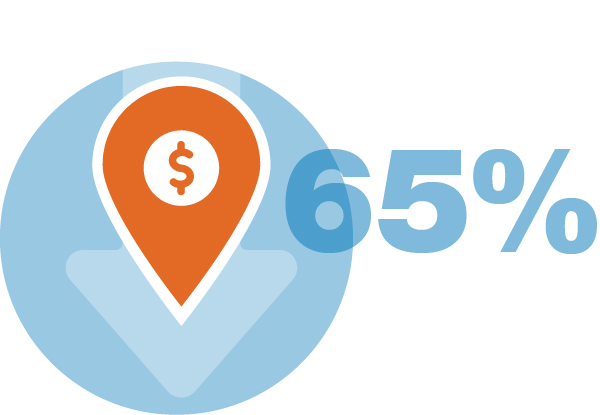
3) Solo adventure travelers account for only 17% of customers - but more than two in five tour operators (42%) say they are developing more itineraries to address their needs.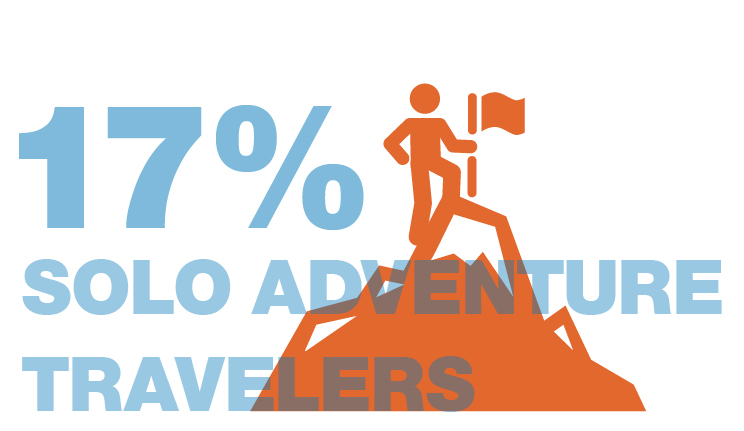
4) Firms headquartered in Asia, with its emerging middle classes, report that their clients are notably younger than in other regions, with an average age of 42, compared to a global average of 48.
Adventure Destinations
1) North and South America are the regions where firms are most likely to report increasing customer interest. In comparison, the Middle East and North Africa, dogged by political instability, are the regions where they are most likely to report decreasing customer interest.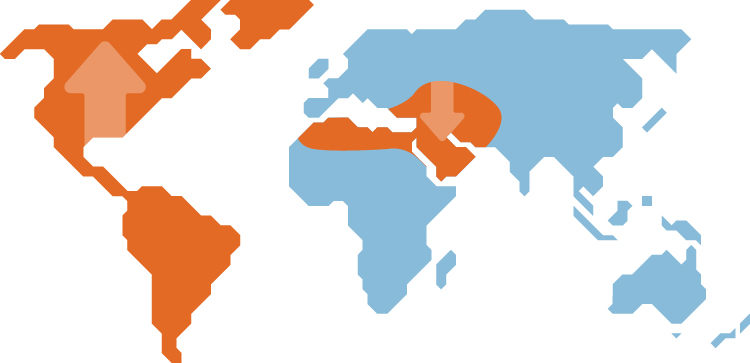
Adventure Products
1) Desire among clients for a more customized experience is clearly growing, with many firms reporting that clients are increasingly looking for completely customized trips. Beyond this, while soft adventures are a clear area of increased customer interest, tour operators report that interest in hard adventures is falling.
More Takeaways
1) The trend for soft adventure is illustrated by the sorts of activities that firms most commonly report that clients are booking. These include safaris, hiking and cycling as well as cultural activities.
2) Compared to 2015, a greater proportion of firms’ marketing budgets are going to content creation, social media outreach and search engine optimization, while spend on trade events and both online and print advertising seems to be falling.
Download ATTA’s 2016 Industry Snapshot to learn more.